The thickness of a coating or film varies slightly from position to position, so a measurement at a single point is not enough to know the overall thickness distribution. Such a thickness distribution can be checked effectively by line measurement, which measures the thickness at many points at once. Accordingly, we present the results of line measurements of a nanometer-scale thin film and a micrometer-scale thick film using t-Nova-575H, the line thickness measurement system from Meter-Lab.
t-Nova-575H is a line thickness measurement system that measures the thickness at about 1,100 points along a measurement line at once. As shown in Figure 1, a beam splitter is placed between the t-Nova-575H body and the sample, and the light reflected from the measurement line on the sample is received by the body. The light entering the body is dispersed by wavelength and recorded as a single spectral image (spatial axis × wavelength axis), and analyzing each row of the spectral image yields the line thickness profile. The maximum image acquisition rate of the sensor is 200 Hz.
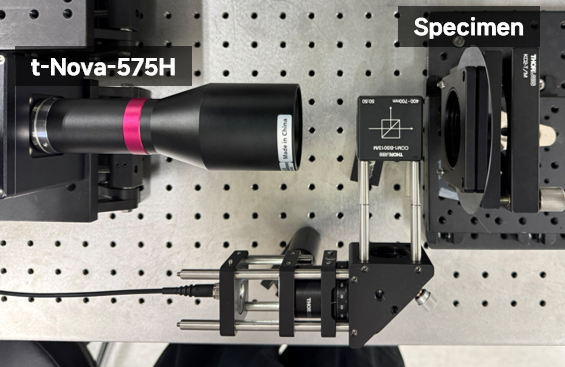 Figure 1. Thickness measurement setup using t-Nova-575H
The analysis method depends on the thickness of the film to be measured. A thin film is too thin to produce distinct interference fringes, so its thickness is obtained by the reflectometric method, which compares the reflectance spectrum with a theoretical curve. In a thick film, on the other hand, light reflected from the top and bottom surfaces of the film produces distinct interference fringes, and the thickness is obtained by the interferometric method, which applies a Fourier transform to these fringes.
First, the line thickness profile of a thin film was measured by the reflectometric method. The sample was a thin-film thickness reference sample with a nominal thickness of 100 nm, and a white LED was used as the light source. The central 20 mm of the sample was divided into 1,104 pixels (pixel resolution 20 μm) for measurement.
Figure 2 shows the acquired spectral image and the reflectance spectrum at the center of the line. The measured reflectance spectrum agreed well with the theoretical curve (coefficient of determination R² = 0.998), and the thickness at this point was analyzed to be 105.430 nm.
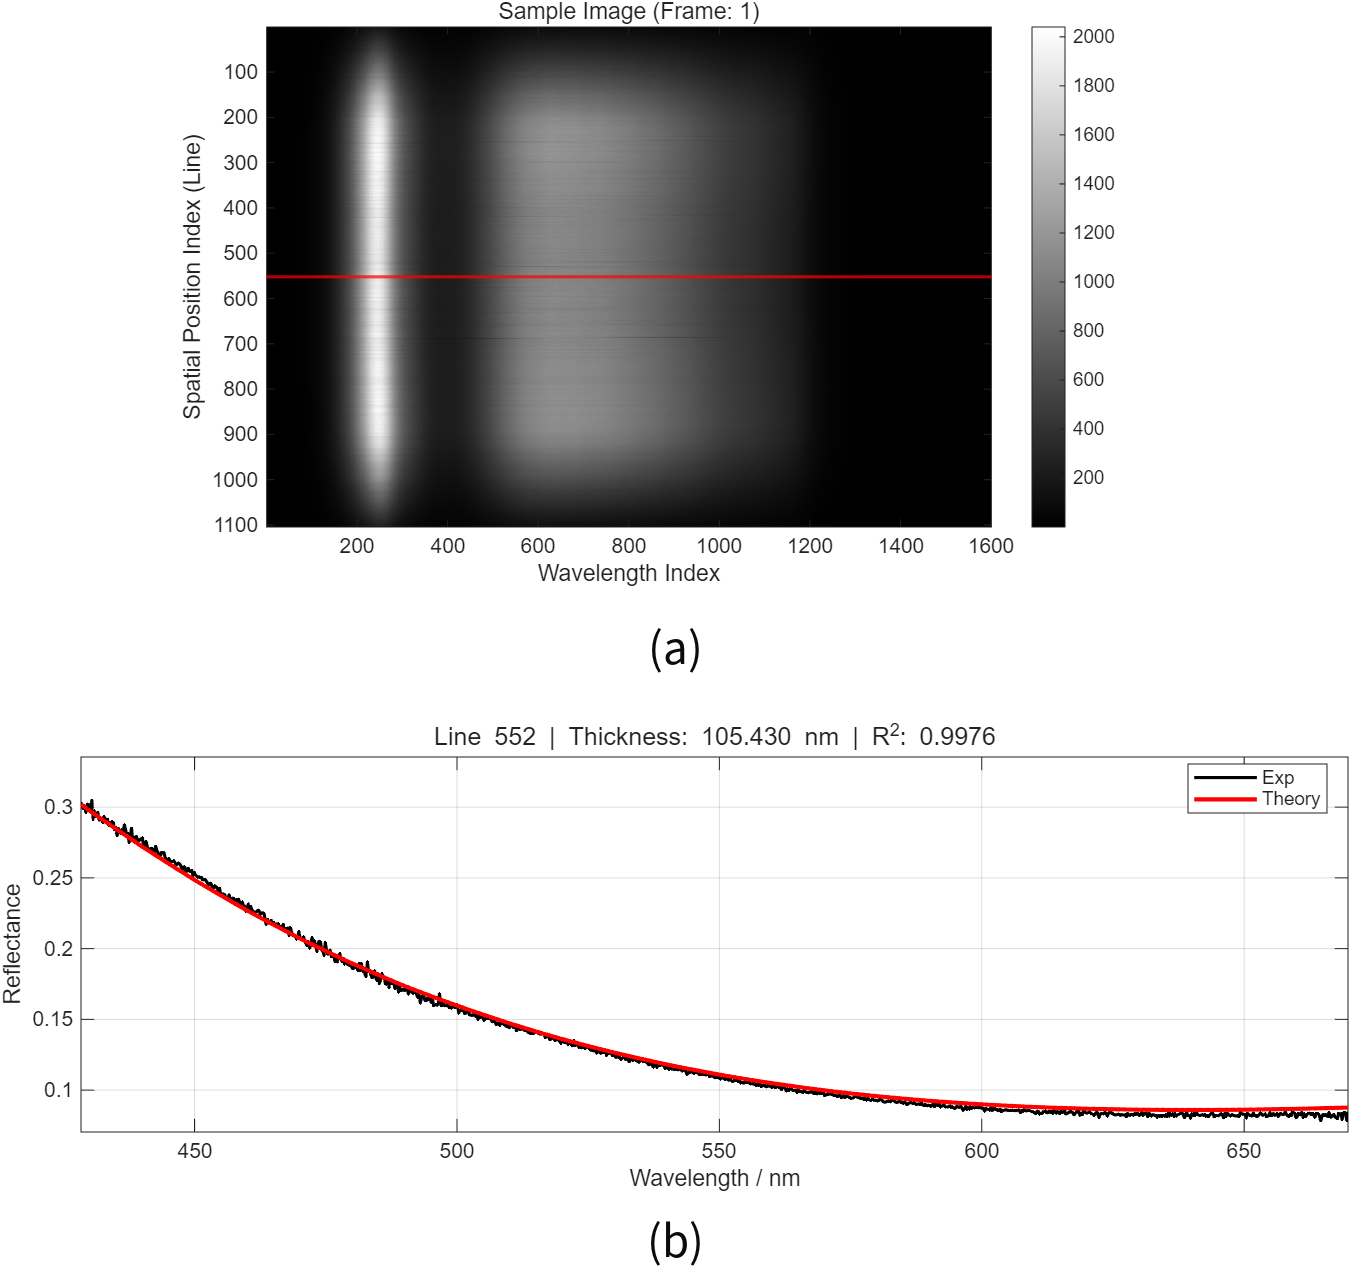
Figure 2. (a) Spectral image of the 100 nm nominal thin-film reference sample, (b) reflectance spectrum and theoretical curve of one line
Figure 3 shows the line thickness profile obtained by averaging the 100 measurements. Across the entire 20 mm line, the thickness varied gradually within about 1 nm, and 90 % of the points along the line fell within 104.5–105.7 nm. In the central part of the line, where the image sharpness is high, the standard deviation of the thickness over the 100 repeated measurements was 0.022 nm or less.
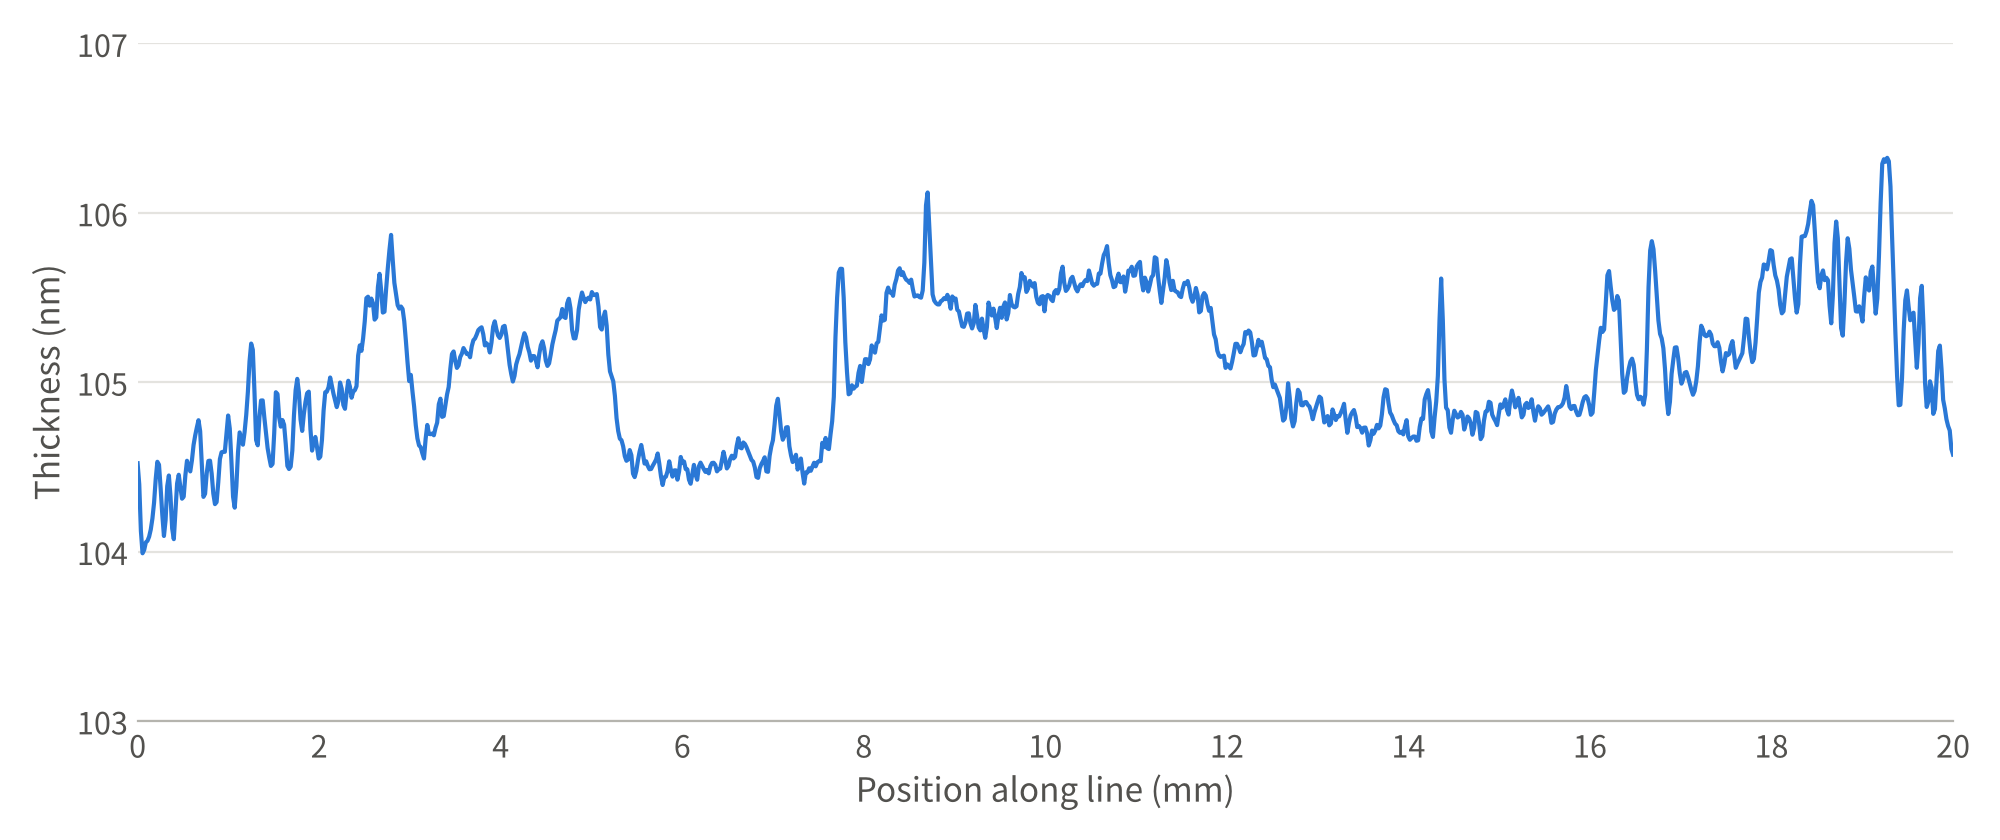
Figure 3. Line thickness profile of the 100 nm nominal thin-film reference sample measured with t-Nova-575H (average of 100 measurements)
Next, the line thickness profile of a thick film was measured by the interferometric method. For this, a real-time line thickness measurement program was applied to t-Nova-575H, and the reference path of the system was blocked so that only the interference within the film remained. The program displays the spectral image, the Fourier transform result of a selected line, and the thickness profile of the entire line on a single screen (Figure 4), and updates the measurement results at up to 4 Hz, including analysis. The thickness was calculated assuming a refractive index of 1.5 for the SiO₂ film.
The vertical stripes in the spectral image in Figure 4 are the interference fringes that carry the thickness information, and the thickness at the center of the line (line 552) was measured as 8.473 μm.
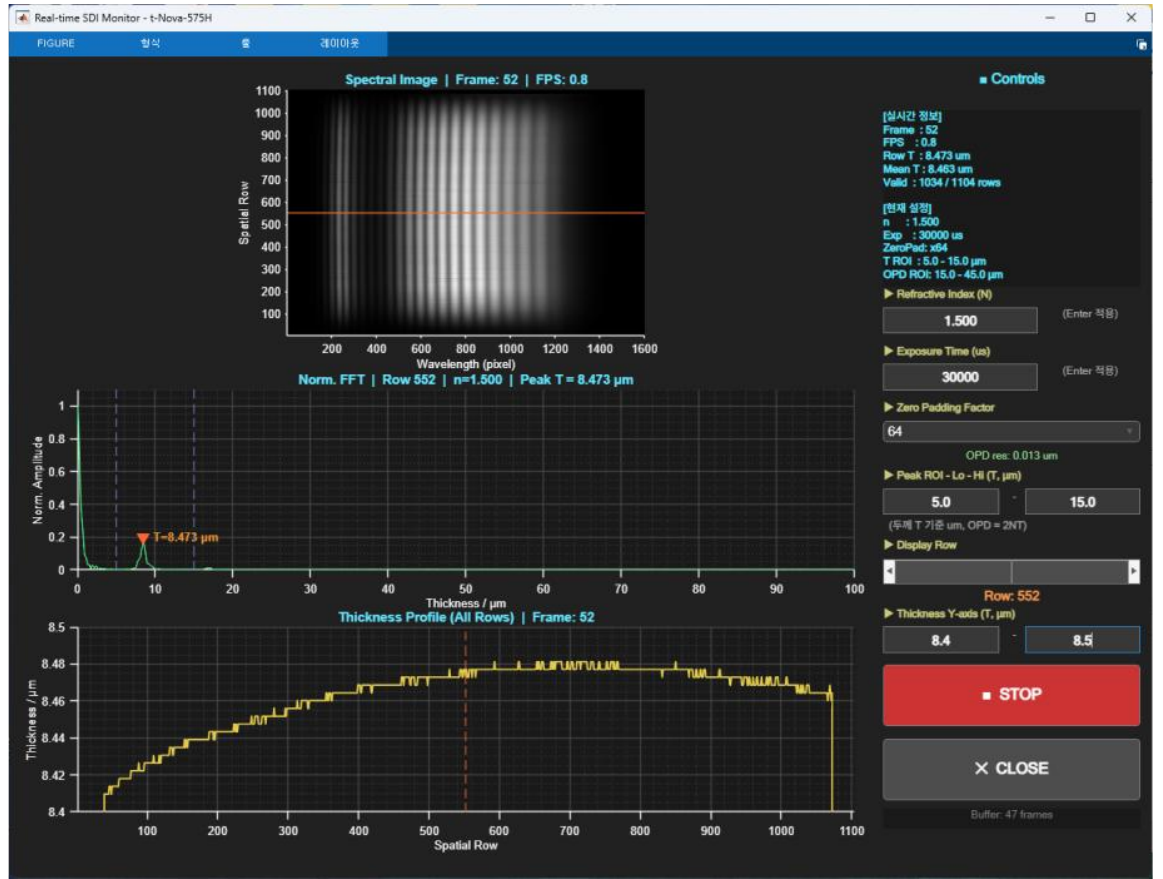 Figure 4. Real-time line thickness measurement program screen for thick-film measurement
The sample was a SiO₂ film with a nominal thickness of 8 μm formed on a metal substrate. Three measurement lines (A, B, C) were set on the sample at 5 mm intervals, and the thickness profile was measured over a 20 mm section of each line (Figure 5). On all three lines, the thickness started at about 8.41 μm at one end and gradually increased to about 8.48 μm past the center, giving a thickness variation of about 70 nm within 20 mm. The profiles of the three lines were nearly identical, confirming that there was almost no thickness variation in the direction perpendicular to the lines.
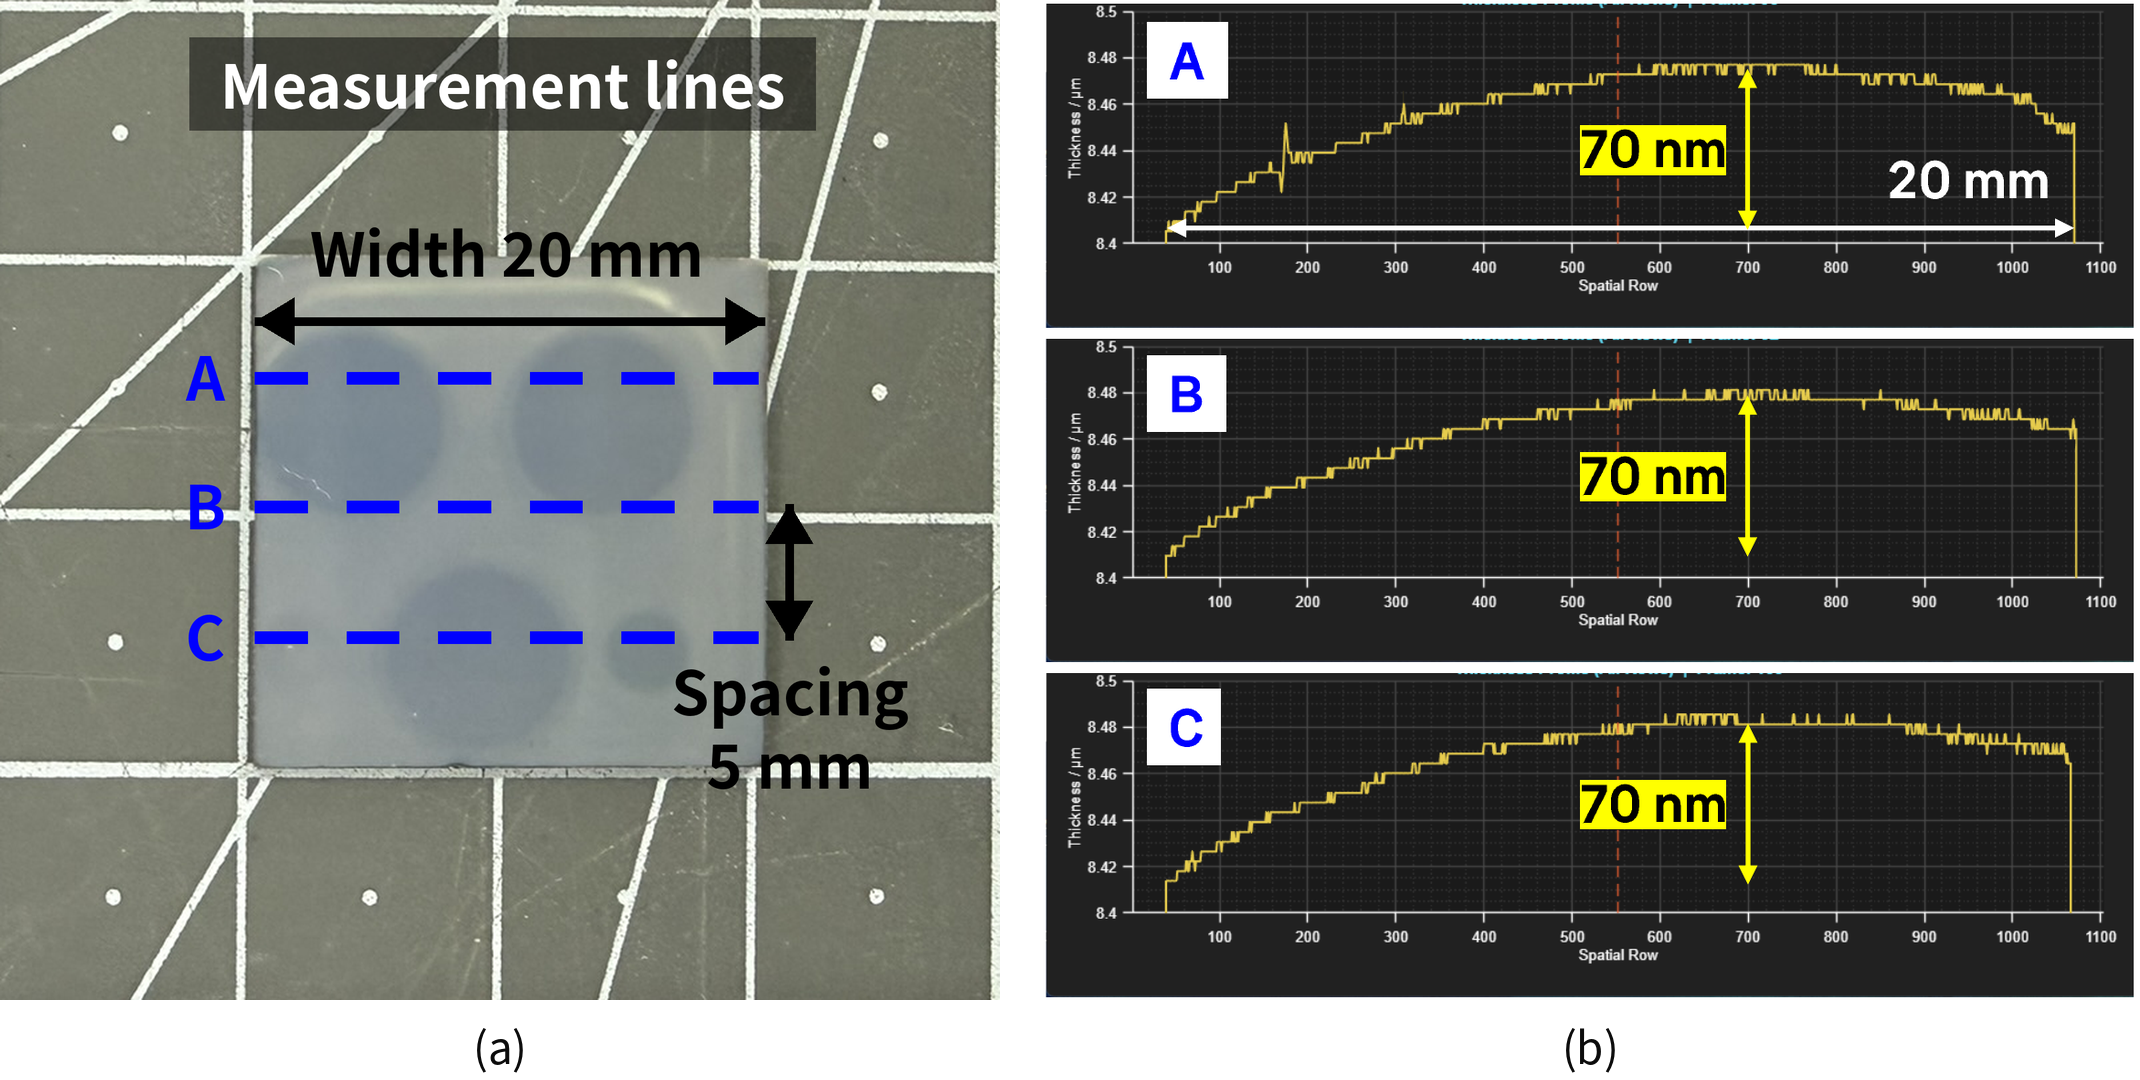
Figure 5. (a) Measurement lines on the 8 μm nominal SiO₂ film sample, (b) thickness profiles of lines A, B, and C
In this way, t-Nova-575H can measure line thickness profiles from nanometer-scale thin films to micrometer-scale thick films with a single line measurement configuration, simply by changing the analysis method. In particular, it can quickly reveal thickness distributions that are easy to miss with single-point measurement, such as the approximately 70 nm thickness variation found in the thick-film sample. We hope that line thickness measurement using t-Nova-575H can be used to check the thickness uniformity of coatings or films.
